I know, I know – AI is stupid… but we shouldn’t be and LLM is a tool that we should get familiar with. That’s why JAS-MIN gets integration with AI in two modes – one-time batch processing and backend assistant.
In this article we will focus on the first type of AI usage. Right now this mode is supported by JAS-MIN using Google models. If you want to start playing with them, you have to start by generating your API key.
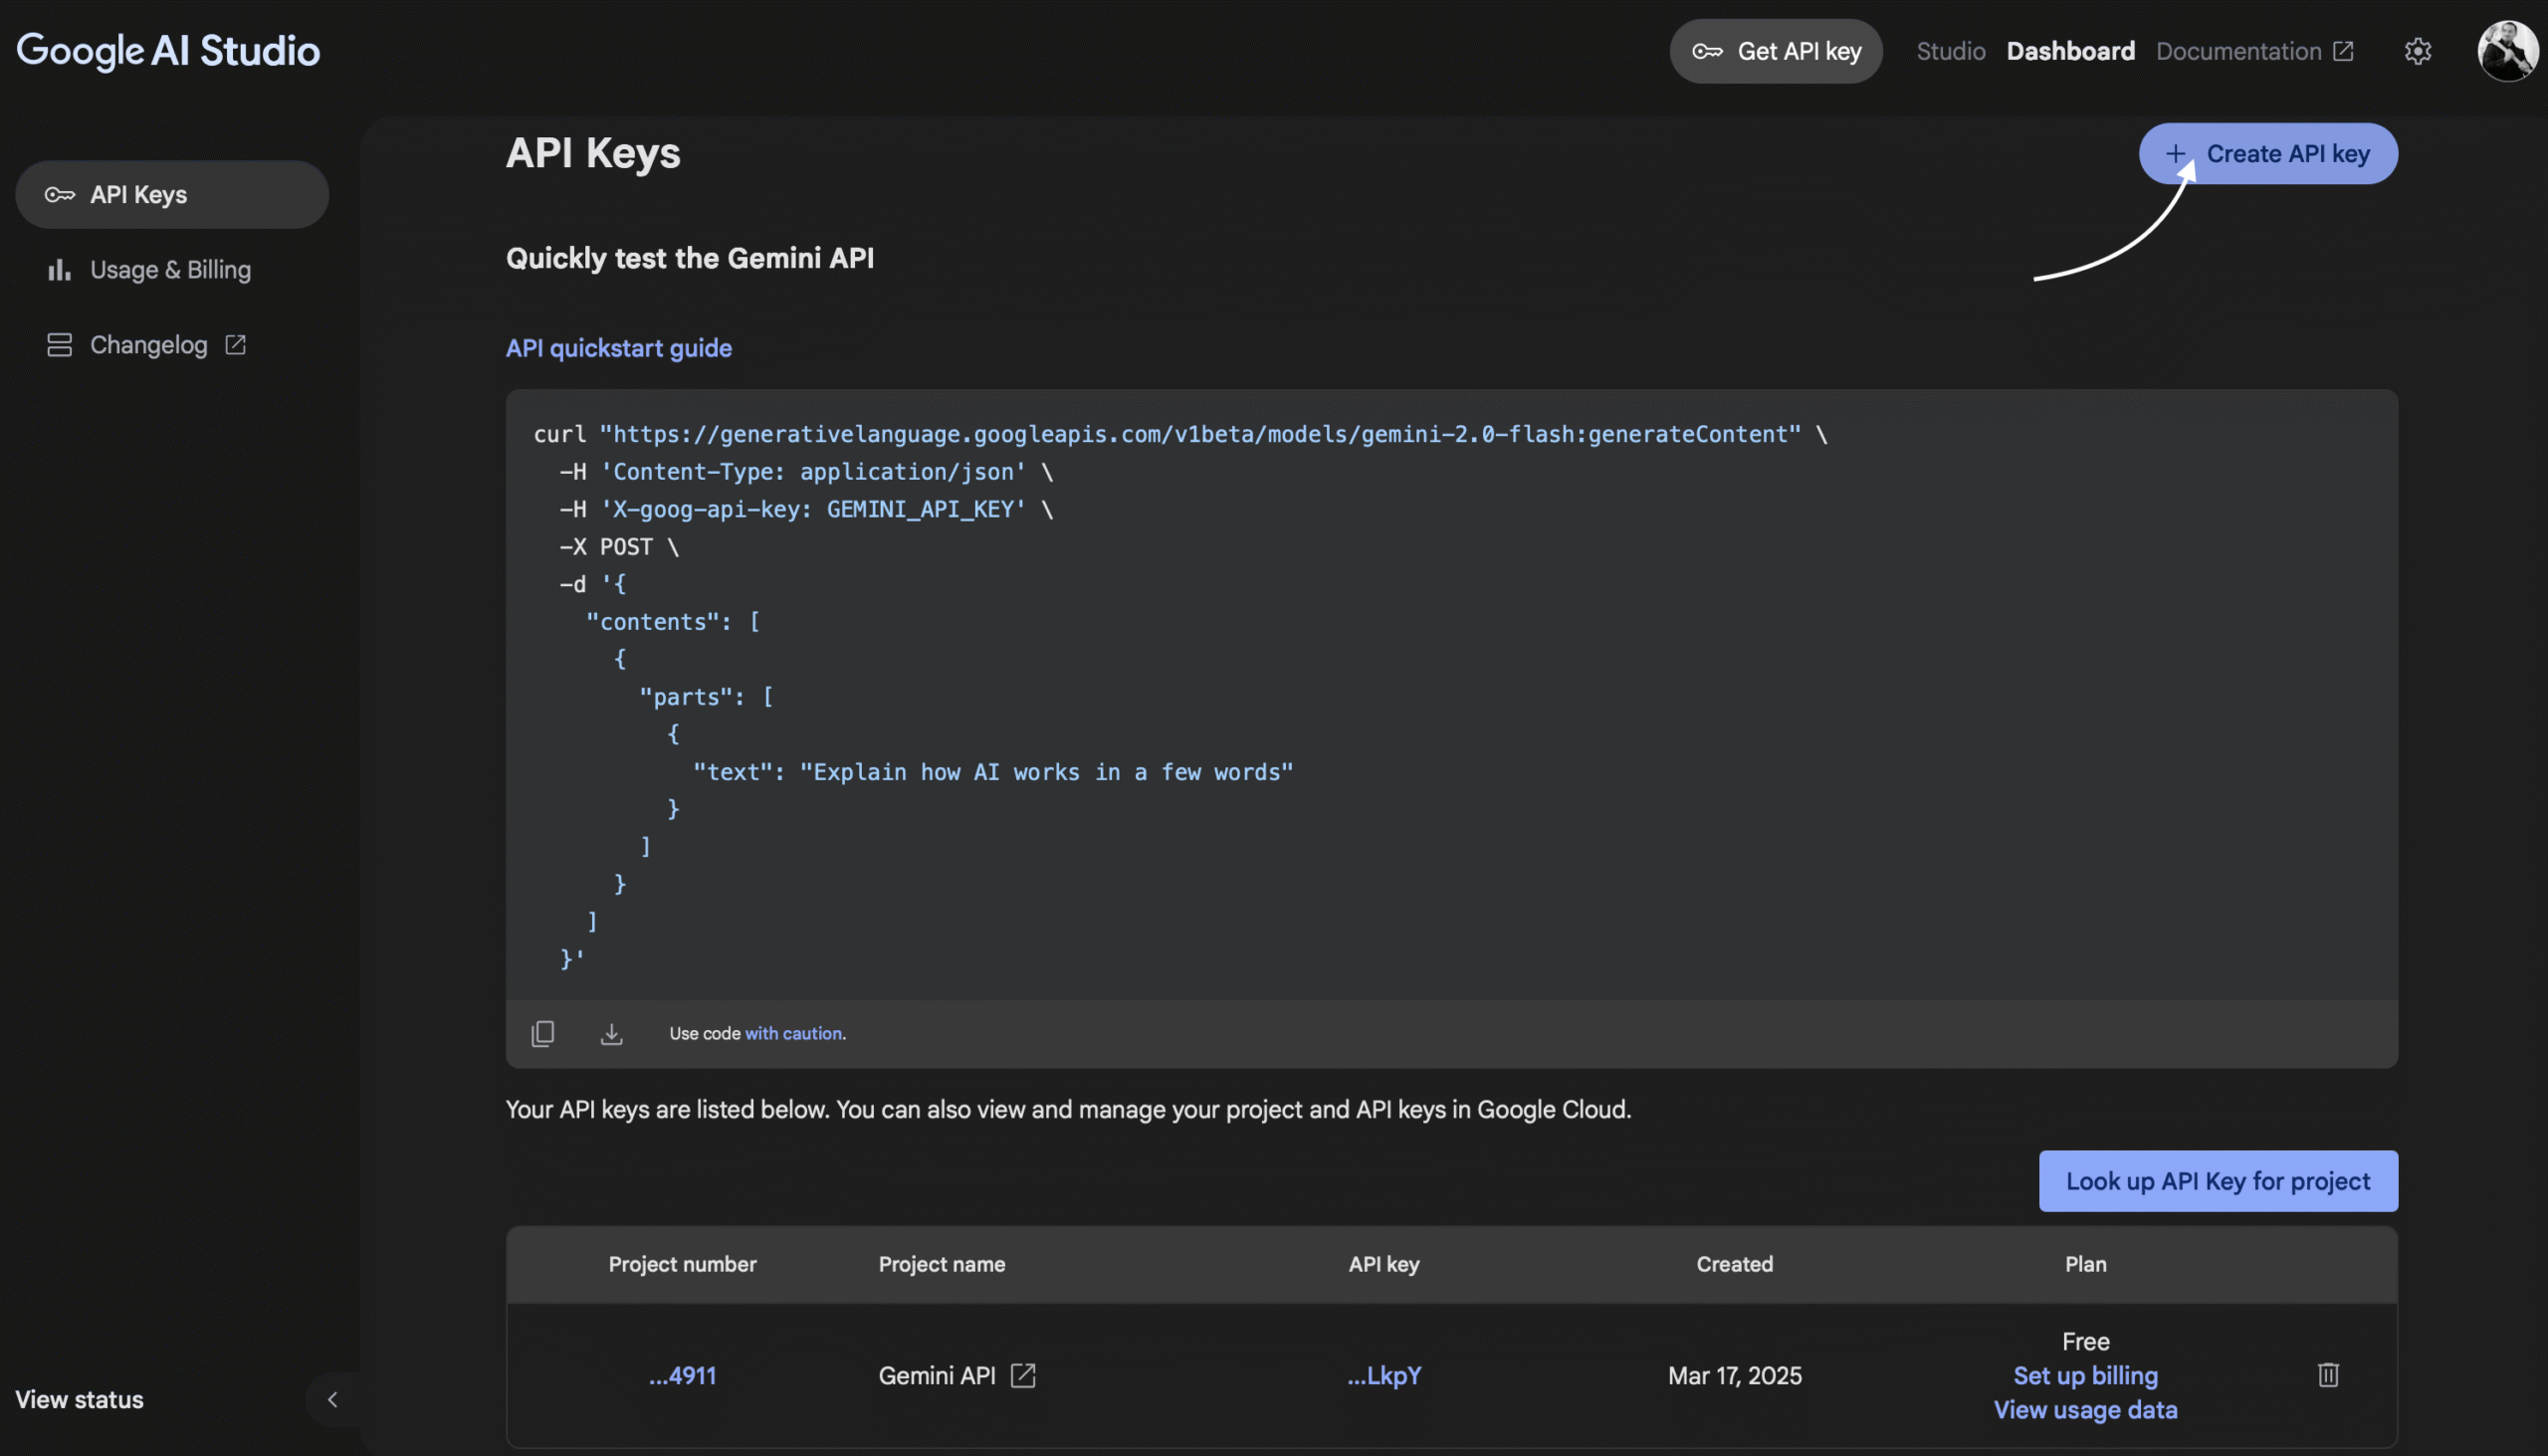
To do that, you should login to https://aistudio.google.com/apikey and click on "Create API key" in the right top corner.
Once you do that, create .env file under $JASMIN_HOME directory. This is my sample .env file:
inter@applerick jul % cat $JASMIN_HOME/.env
OPENAI_API_KEY=asdasdljnslfnjwlfjnwjefnwekjfnwlefnwlendlakdalksndmalkdfnmdlskfnsdlkfnslkfden

OPENAI_ASST_ID=asst_asldnasldnalkdnalkdnalkendna

GEMINI_API_KEY=asldknnasldknmaslkdmalkdwmalkwmdalkdmalksdm

PORT=3000If you have it prepared, launching JAS-MIN in AI mode is trivial:
inter@applerick jul % jas-min -d awrs --security-level=1 -W 10 -q --ai google:gemini-2.5-flash:EN
✅ Loaded .env from JASMIN_HOME: "/Users/inter/ORA-600/scripts/oracle/audit_tools/performance/jasmin_home/.env"
JAS-MIN v0.6.4 (Running with parallel degree: 4)

==== PARSING DIRECTORY DATA ===
[00:00:02] [########################################] 327/327 (100%)
Starting output capture to: awrs.txt

==== ANALYZING ===
==== DBCPU/DBTime ratio analysis ====
Peaks are being analyzed based on specified ratio (default 0.666).
The ratio is beaing calculated as DB CPU / DB Time.
The lower the ratio the more sessions are waiting for resources other than CPU.
If DB CPU = 2 and DB Time = 8 it means that on AVG 8 actice sessions are working but only 2 of them are actively working on CPU.
Current ratio used to find peak periods is 0.666

==== Median Absolute Deviation ====
        MAD threshold = 7
        MAD window size=10% (32 of probes out of 327)

Analyzing a peak in awrs/awrrpt_1_1846_1847.html (03-Lip-25 02:00:01) for ratio: [11.30/355.40] = 0.03
Analyzing a peak in awrs/awrrpt_1_1847_1848.html (03-Lip-25 03:00:10) for ratio: [11.70/348.50] = 0.03
Analyzing a peak in awrs/awrrpt_1_1848_1849.html (03-Lip-25 04:00:19) for ratio: [12.10/374.20] = 0.03
Analyzing a peak in awrs/awrrpt_1_1849_1850.html (03-Lip-25 05:00:28) for ratio: [12.10/384.50] = 0.03
Analyzing a peak in awrs/awrrpt_1_1850_1851.html (03-Lip-25 06:00:37) for ratio: [11.70/471.30] = 0.02
Analyzing a peak in awrs/awrrpt_1_1851_1852.html (03-Lip-25 07:00:45) for ratio: [16.50/667.90] = 0.02
Analyzing a peak in awrs/awrrpt_1_1852_1853.html (03-Lip-25 08:00:57) for ratio: [13.90/910.80] = 0.02
Analyzing a peak in awrs/awrrpt_1_1853_1854.html (03-Lip-25 09:00:05) for ratio: [15.50/1017.80] = 0.02
Analyzing a peak in awrs/awrrpt_1_1854_1855.html (03-Lip-25 10:00:17) for ratio: [16.40/1080.90] = 0.02

****Detecting anamalies using MAD sliding window****


==== CREATING PLOTS ===
Saved plots for Foreground events to 'awrs.html_reports/fg_*'
Saved plots for Background events to 'awrs.html_reports/bg_*'
Saved plots for SQLs to 'awrs.html_reports/sqlid_*'
Saved plots for IO Stats to 'awrs.html_reports/iostats_*'

==== PREPARING RESULTS ===
Foreground Wait Events
Background Wait Events
TOP SQLs by Elapsed time (SQL_ID or OLD_HASH_VALUE presented)
Statistics
Anomalies Summary
Generating Plots

==== DONE ===
JAS-MIN Report saved to: awrs.html_reports/jasmin_main.html

=== Consulting Google Gemini model: gemini-2.5-flash ===
Private reasonings.txt loaded from /ORA-600/jasmin_home/reasonings.txt
✅ File uploaded! URI: https://generativelanguage.googleapis.com/v1beta/files/vyrc51t316ep
✅ awrs.html_reports/jasmin_highlight.png uploaded! URI: https://generativelanguage.googleapis.com/v1beta/files/hqbvy1xo9o15
✅ awrs.html_reports/jasmin_highlight2.png uploaded! URI: https://generativelanguage.googleapis.com/v1beta/files/jx3ktfzq7dyg
✅ Got response!
🍻 Gemini response written to file: awrs.txt_gemini.md
✅ HTML file generated at: "awrs.txt_gemini.html"Let’s break down the options:
- -d awrs – parse directory containing AWR html files
- –security-level=1 – default security level is 0 which means that no segment names nor SQL Text will be added to the report, with security level set to 1 segment names will be added and with 2 – also text of SQLs
- -W 10 – sliding window for MAD algorithm will be set to 10% of probe data
- -q – use quiet mode – suppresses output
- –ai google:gemini-2.5-flash:EN – use vendor name google, model gemini-2.5-flash and output language should be English
If you want to understand more about the options and how to start with JAS-MIN, check those articles by Radek Kut:
https://blog.struktuur.pl/blog/jasmin_part1
https://blog.struktuur.pl/blog/jasmin_part2
There is one interning information provided by JAS-MIN:
Private reasonings.txt loaded from /ORA-600/jasmin_home/reasonings.txt
This means that JAS-MIN found file, named reasonings.txt which she than used to make the prompt for LLM reacher. You can put in this file whatever you want – for example:
- Focus on anomalies clusters which where detected using Median Absolute Deviation. ("DC:" is Dictionary Cache and "LC:" is Library Cache, "TM:" is Time Model)
- In anomaly cluster take into considaration patterns of occuring latches - explain problematic latches and what is the meaning of correlation between latches, statistics and wait events - try to dig into your knowledge to decode latch names into something usefull and try to understand the reason of the problem
- Show anomaly clusters
- Show which period had the biggest amount of anomalies
- Show which SQLs where in the same anomalie clusters as the heaviest wait events
- Check the anomalies summary and try to find patterns - for example which STAT: had anomalies in the same time as some heavy SQLs and WAIT EVENTs
AI will be analyzing 3 files to produce the output:
- awrs.txt – the format is directory_name.txt and it is the main file that is being analyzed by LLM – in this file you can find all analyzes that JAS-MIN is producing, all calculated statistics, detected anomalies and performance spikes.
- awrs.html_reports/jasmin_highlight.png – first chart with load profile
- awrs.html_reports/jasmin_highlight2.png – second chart with load profile
The output is provided in markdown format – awrs.txt_gemini.md and than it is converted into html.
And this is the final output:
https://ora-600.pl/jasmin/awrs.txt_gemini.html
You may notice that MOS notes numbers may be wrong right now, but we are working on limiting hallucinations 🙂
Now create your own reasonings.txt file and have fun, but beware of AI hallucinations – this is just a tool that can make your analyzes faster, but only your own strong internal context can be used to verify the outcome.