Not having Diagnostic Pack sucks. But event if you have it, it is not that obvious that you will be able to visualize properly the data and perform a meaningful analyze. That’s why I have created JAS-MIN!
A little background:
In my work I often have to analyze customer’s databases in order to understand overall database performance condition. Most of my customers don’t have Enterprise Edition and even if they do, it’s really hard to get remote access over VPN to database server or to install any agent or event ask to run a simple script on a database.
Usually customers just send me about 666 STATSPACK or AWR reports to analyze them and create some report about the condition of the database. For years I developed a lot of small shell and Python scripts to analyze those reports. Unfortunately security teams got more suspicious lately and they are even blocking the ability to send me complete STATSPACK or AWR reports.
Because of that I thought about creating a tool that could anonymize those reports by creating a simple JSON file that could contain only statistics like wait event names, instance stats, SQL_IDs and no other data that could potentially lead to any security issues.
I was introducing this tool at SOUC Database Circle 2024 and I remember that I didn’t have a name for the tool, so Patrick Jolliffe asked if I could name it Jasmine, because our friend (Jasmin Fluri – one of the SOUC founders) – was standing with us. I thought: JSON-AWR-Statspack Miner… JAS-MIN! Yes, that works!
So that’s how JAS-MIN was born and introduced – but since then she evolved and can do some awesome stuff.
So here it is: https://github.com/ora600pl/jas-min
How to use it? It’s pretty simple:
Install RUST: https://www.rust-lang.org/tools/install
Download JAS-MIN:
inter@applerick jas-min-statspack % git clone https://github.com/ora600pl/jas-min
Cloning into 'jas-min'...
remote: Enumerating objects: 278, done.
remote: Counting objects: 100% (21/21), done.
remote: Compressing objects: 100% (15/15), done.
remote: Total 278 (delta 10), reused 15 (delta 6), pack-reused 257 (from 1)
Receiving objects: 100% (278/278), 193.20 KiB | 2.15 MiB/s, done.
Resolving deltas: 100% (154/154), done.
Compile it:
inter@applerick jas-min % cargo build --release
   Compiling proc-macro2 v1.0.78
   Compiling unicode-ident v1.0.12
(...)
 Compiling jas-min v0.2.0 (/Users/inter/Library/Mobile Documents/com~apple~CloudDocs/Documents/ORA-600/Konferencyjne/jas-min-statspack/jas-min)
    Finished release [optimized] target(s) in 19.64s
warning: the following packages contain code that will be rejected by a future version of Rust: buf_redux v0.8.4, multipart v0.18.0
note: to see what the problems were, use the option `--future-incompat-report`, or run `cargo report future-incompatibilities --id 1`
And JAS-MIN is ready to be used!
inter@applerick jas-min % ./target/release/jas-min -h
jas-min 0.2.0
Kamil Stawiarski <kamil@ora-600.pl>, Radosław Kut <radek@ora-600.pl>
This tool will parse STATSPACK or AWR report into JSON format which can be used by visualization
tool of your choice. The assumption is that text file is a STATSPACK report and HTML is AWR, but it
tries to parse AWR report also. It was tested only against 19c reports The tool is under development
and it has a lot of bugs, so please test it and don't hasitate to suggest some code changes :)

USAGE:
    jas-min [OPTIONS]

OPTIONS:
    -d, --directory <DIRECTORY>
            Parse whole directory of files [default: NO]

    -f, --filter-db-time <FILTER_DB_TIME>
            Filter only for DBTIME greater than (if zero the filter is not effective) [default: 0]

        --file <FILE>
            Parse a single text or html file [default: NO]

    -h, --help
            Print help information

    -j, --json-file <JSON_FILE>
            Analyze provided JSON file [default: NO]

    -o, --outfile <OUTFILE>
            Write output to nondefault file? Default is directory_name.json [default: NO]

    -p, --plot <PLOT>
            Draw a plot? [default: 1]

    -s, --server <SERVER>
            Run in server mode - you can parse files via GET/POST methods. HTTP will listen on 6751
            port by default [default: 0.0.0.0:6751]

    -t, --time-cpu-ratio <TIME_CPU_RATIO>
            Ratio of DB CPU / DB TIME [default: 0.666]

    -V, --version
            Print version information
JAS-MIN can run as a server and provide JSON files to Graphana or some other tool, but to be honest – you don’t need it anymore so don’t get attached to this functionality.
The basic usage is parsing directory full of STATSPACK or AWR reports – by default JAS-MIN recognizes two types of files:
- *.txt – STATSPACK files
- *.html – AWR files
You can generate a set of statspack files with gen_statspack_reps.sh script and set of AWR scripts using awr-generator.sql written by @flashdba
Of course you need at least a week of reports to make something useful out of it.
Let’s use jas-min with default parameters (it takes around 21s to parse almost 922M of HTML data – 415 files – on my laptop):
At the beginning of the output report you will notice something like this:
inter@applerick jas-min % time jas-min -d ../AWR_UCL
Analyzing a peak in awrrpt_1_135981_135982.html (12-Wrz-24 07:00:25) for ratio: [29.90/57.90] = 0.52
Analyzing a peak in awrrpt_1_135982_135983.html (12-Wrz-24 07:30:35) for ratio: [30.30/62.80] = 0.48
Analyzing a peak in awrrpt_1_135987_135988.html (12-Wrz-24 10:00:29) for ratio: [42.60/66.20] = 0.64
Analyzing a peak in awrrpt_1_135988_135989.html (12-Wrz-24 10:30:42) for ratio: [39.40/59.70] = 0.66
Analyzing a peak in awrrpt_1_135989_135990.html (12-Wrz-24 11:00:56) for ratio: [39.70/60.80] = 0.65
Analyzing a peak in awrrpt_1_135991_135992.html (12-Wrz-24 12:00:20) for ratio: [41.90/67.60] = 0.62
Analyzing a peak in awrrpt_1_135992_135993.html (12-Wrz-24 12:30:33) for ratio: [41.60/67.10] = 0.62
Analyzing a peak in awrrpt_1_135993_135994.html (12-Wrz-24 13:00:46) for ratio: [45.30/74.70] = 0.61
Analyzing a peak in awrrpt_1_135994_135995.html (12-Wrz-24 13:30:59) for ratio: [44.20/73.40] = 0.60
JAS-MIN is developed to analyze performance spikes, but what does it mean? By default she analyzes the factor of DB CPU divided by DB Time and if the result is lower than 0.666, she considers it as a performance spike.
Why? Well, we can say that DB Time in s/s is like the average number of active sessions per second on your database. There are smarter people than me that can explain it and here is one of the presentations that does it well: https://www.slideshare.net/jberesni/db-time-average-active-sessions-and-ash-math-oracle-performance-fundamentals-228654679#2
So JAS-MIN is taking average active sessions (DB Time s/s) and divides it by DB CPU (s/s) to check what is the proportion – the bigger the proportion (smaller ratio), the more sessions should wait on some foreground wait events.
So JAS-MIN in the first section is telling you what are the spikes that she is taking under consideration – from each spike JAS-MIN is interpreting top wait events and top SQLs from SQLs ordered by Elapsed Time to plot them in the chart.
You can adjust the ratio like this:
inter@applerick jas-min-statspack % jas-min -d AWR_UCL -t 0.3
Analyzing a peak in awrrpt_1_136230_136231.html (17-Wrz-24 11:30:02) for ratio: [54.90/184.30] = 0.30
Analyzing a peak in awrrpt_1_136233_136234.html (17-Wrz-24 13:00:55) for ratio: [54.70/200.10] = 0.27
Analyzing a peak in awrrpt_1_136234_136235.html (17-Wrz-24 13:30:19) for ratio: [56.30/214.90] = 0.26
Analyzing a peak in awrrpt_1_136235_136236.html (17-Wrz-24 14:00:40) for ratio: [56.10/223.80] = 0.25
Analyzing a peak in awrrpt_1_136236_136237.html (17-Wrz-24 14:30:58) for ratio: [56.20/233.70] = 0.24
Analyzing a peak in awrrpt_1_136237_136238.html (17-Wrz-24 15:00:21) for ratio: [56.60/251.00] = 0.23
Analyzing a peak in awrrpt_1_136238_136239.html (17-Wrz-24 15:30:39) for ratio: [56.80/224.70] = 0.25
Analyzing a peak in awrrpt_1_136239_136240.html (17-Wrz-24 16:00:58) for ratio: [56.80/226.60] = 0.25
Analyzing a peak in awrrpt_1_136240_136241.html (17-Wrz-24 16:30:15) for ratio: [57.10/218.30] = 0.26
Analyzing a peak in awrrpt_1_136241_136242.html (17-Wrz-24 17:00:37) for ratio: [56.30/193.80] = 0.29
Analyzing a peak in awrrpt_1_136242_136243.html (17-Wrz-24 17:30:56) for ratio: [57.40/192.70] = 0.30
Analyzing a peak in awrrpt_1_136243_136244.html (17-Wrz-24 18:00:13) for ratio: [56.90/203.80] = 0.28
Analyzing a peak in awrrpt_1_136244_136245.html (17-Wrz-24 18:30:33) for ratio: [57.60/338.00] = 0.17
Analyzing a peak in awrrpt_1_136245_136246.html (17-Wrz-24 19:00:59) for ratio: [56.20/446.10] = 0.13
Analyzing a peak in awrrpt_1_136246_136247.html (17-Wrz-24 19:30:15) for ratio: [56.80/465.60] = 0.12
Analyzing a peak in awrrpt_1_136247_136248.html (17-Wrz-24 20:00:32) for ratio: [56.50/534.20] = 0.11
Analyzing a peak in awrrpt_1_136248_136249.html (17-Wrz-24 20:30:51) for ratio: [56.20/641.30] = 0.09
Analyzing a peak in awrrpt_1_136249_136250.html (17-Wrz-24 21:00:15) for ratio: [55.70/546.50] = 0.10
Analyzing a peak in awrrpt_1_136250_136251.html (17-Wrz-24 21:30:35) for ratio: [56.10/442.20] = 0.13
Analyzing a peak in awrrpt_1_136251_136252.html (17-Wrz-24 22:00:56) for ratio: [53.90/236.20] = 0.23
Analyzing a peak in awrrpt_1_136345_136346.html (19-Wrz-24 21:00:21) for ratio: [55.50/210.10] = 0.26
You could also filter out only DB Times than are larger than X:
inter@applerick jas-min-statspack % jas-min -d AWR_UCL -t 0.3 -f 200
Analyzing a peak in awrrpt_1_136233_136234.html (17-Wrz-24 13:00:55) for ratio: [54.70/200.10] = 0.27
Analyzing a peak in awrrpt_1_136234_136235.html (17-Wrz-24 13:30:19) for ratio: [56.30/214.90] = 0.26
Analyzing a peak in awrrpt_1_136235_136236.html (17-Wrz-24 14:00:40) for ratio: [56.10/223.80] = 0.25
Analyzing a peak in awrrpt_1_136236_136237.html (17-Wrz-24 14:30:58) for ratio: [56.20/233.70] = 0.24
Analyzing a peak in awrrpt_1_136237_136238.html (17-Wrz-24 15:00:21) for ratio: [56.60/251.00] = 0.23
Analyzing a peak in awrrpt_1_136238_136239.html (17-Wrz-24 15:30:39) for ratio: [56.80/224.70] = 0.25
Analyzing a peak in awrrpt_1_136239_136240.html (17-Wrz-24 16:00:58) for ratio: [56.80/226.60] = 0.25
Analyzing a peak in awrrpt_1_136240_136241.html (17-Wrz-24 16:30:15) for ratio: [57.10/218.30] = 0.26
Analyzing a peak in awrrpt_1_136243_136244.html (17-Wrz-24 18:00:13) for ratio: [56.90/203.80] = 0.28
Analyzing a peak in awrrpt_1_136244_136245.html (17-Wrz-24 18:30:33) for ratio: [57.60/338.00] = 0.17
Analyzing a peak in awrrpt_1_136245_136246.html (17-Wrz-24 19:00:59) for ratio: [56.20/446.10] = 0.13
Analyzing a peak in awrrpt_1_136246_136247.html (17-Wrz-24 19:30:15) for ratio: [56.80/465.60] = 0.12
Analyzing a peak in awrrpt_1_136247_136248.html (17-Wrz-24 20:00:32) for ratio: [56.50/534.20] = 0.11
Analyzing a peak in awrrpt_1_136248_136249.html (17-Wrz-24 20:30:51) for ratio: [56.20/641.30] = 0.09
Analyzing a peak in awrrpt_1_136249_136250.html (17-Wrz-24 21:00:15) for ratio: [55.70/546.50] = 0.10
Analyzing a peak in awrrpt_1_136250_136251.html (17-Wrz-24 21:30:35) for ratio: [56.10/442.20] = 0.13
Analyzing a peak in awrrpt_1_136251_136252.html (17-Wrz-24 22:00:56) for ratio: [53.90/236.20] = 0.23
Analyzing a peak in awrrpt_1_136345_136346.html (19-Wrz-24 21:00:21) for ratio: [55.50/210.10] = 0.26
The next section is "Correlations"
Be aware that JAS-MIN is using Pearson correlation coefficient between DB Time and wait events, SQLs elapsed time and instance statistics.
Remember that correlation is not causation!
Correlation simple means that two variables are changing in time in the same way. In our performance analysis it just simply tells you, that you have to consider taking a closer look at some wait events or SQLs – it helps you to start your investigation but it won’t give you a straight answer – it would be to easy 😉
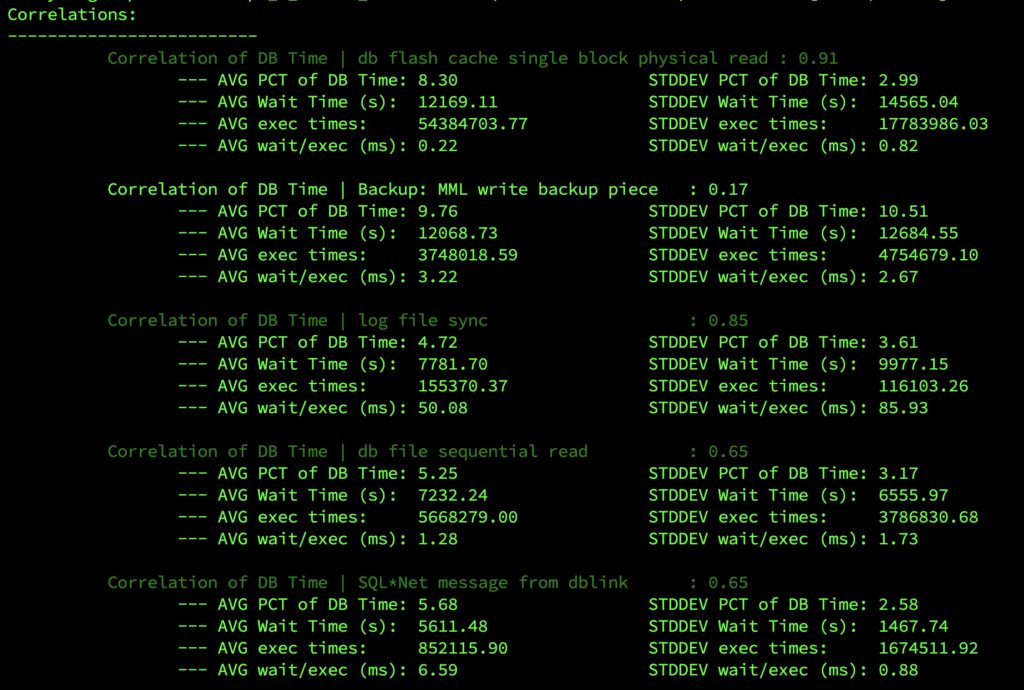
Wait event correlation example:

In RED I’m marking correlations that are higher than 0.4. You can see here also statistics about averages and standard deviations.
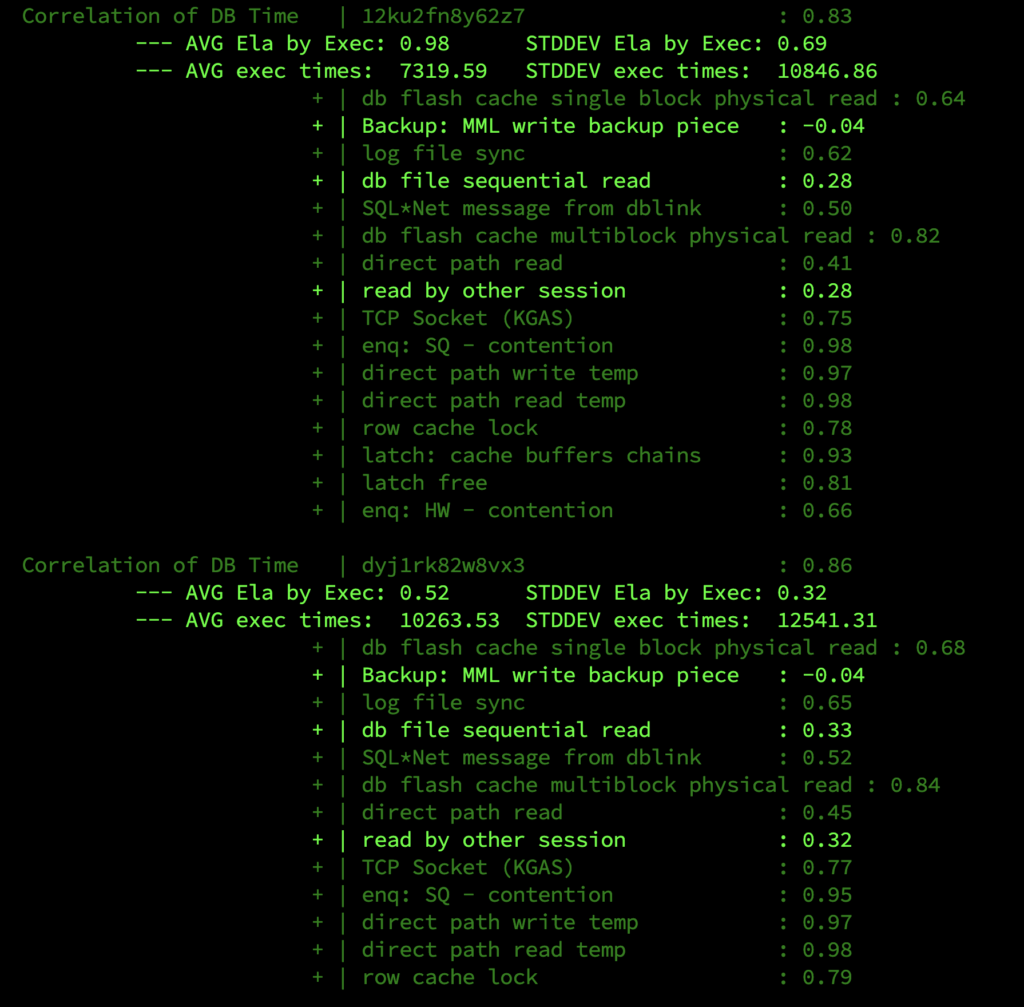
Next you can see correlation of SQL_IDs with DB Time plus correlation of that SQL ID with particular wait events:

And again you can see some additional statistics about SQLs. For example 12ku2fn8y62z7 is executing on average only 0.98s but it executes 7319.59 times per snap and there was STDDEV = 10846.86 which basically means that this SQL is executing a lot and there was a time when it was executed more times than usual.
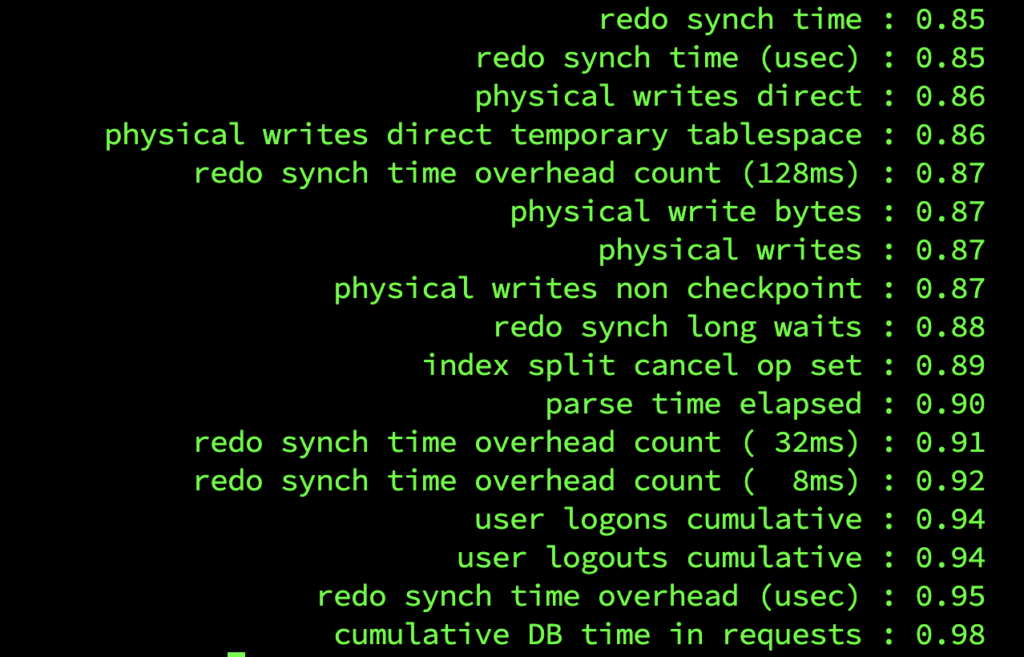
The last section is about instance statistics correlation:

When you see something like this, you could expect that there might be some logon storm going on the database.
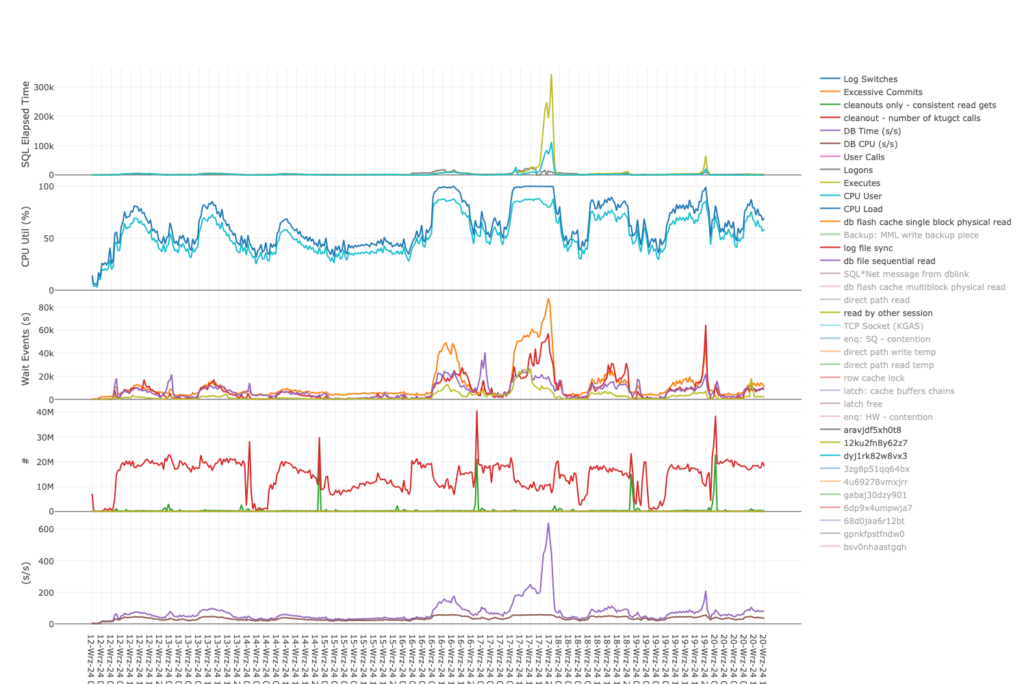
After displaying a report, JAS-MIN uses Plotly to plot some interactive charts – you can download a sample chart here:
It looks like this:

If someone wants your help with analyzing AWR or STATSPACK reports and they don’t want to send you whole reports, they could use JAS-MIN to produce a JSON file (which is the created by JAS-MIN in the same location as CWD and is named like DIRECTORY_NAME.json)
Than you could use JAS-MIN just to analyze the file itself:

The tool is being developed by Radosław Kut and I right now and we are open to suggestions about some bugs you find or new features 🙂
Together Gianni Ceresa we are working on creating something much more useful that could help you to find some patterns or anomalies and what could help you in finding performance problems much easier.
We won’t fix them for you tho 😉
You can learn more about JAS-MIN in my (or Radosław) next blog posts on many conferences we are going to attend next year 😀
We hope you will find this tools useful as a quick start for performance troubleshooting – especially if you have only STATSPACK.
Cheers! 🍻
